O-LevelPhysicsForces5054/12 · May/June 2018 · Q161 Mark
Five blocks have the same mass but different base areas. They all rest on a horizontal table. A graph is plotted to show the relationship between the pressure exerted on the table and the base area of the block. Which graph shows this relationship?
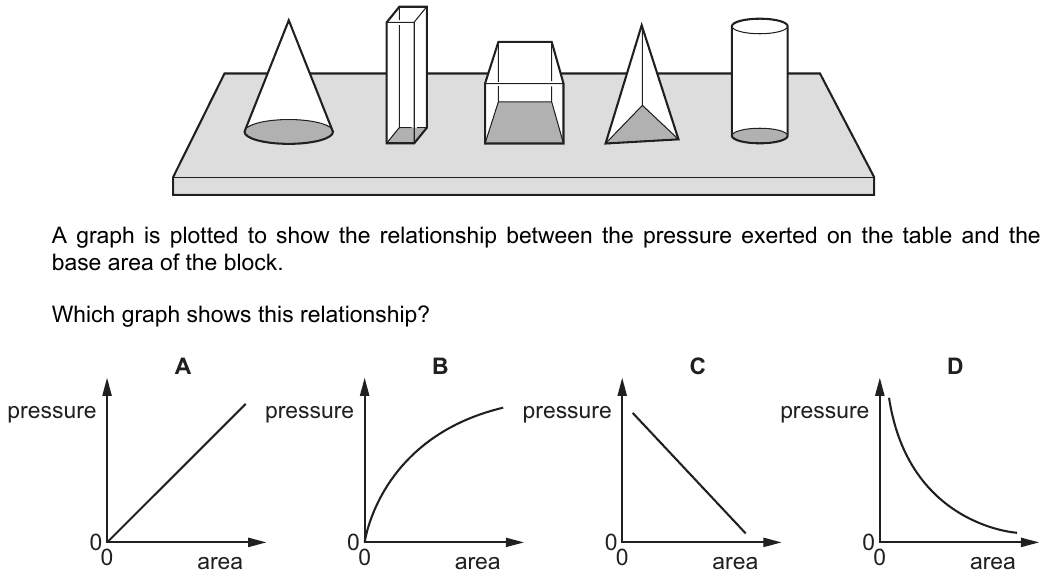
This question uses a diagram from the original paper, which isn't shown here. Open the full paper from the past papers archive to see it.
Agraph showing pressure increasing linearly with area from the origin.
Bgraph showing pressure increasing non-linearly with area.
Cgraph showing pressure decreasing non-linearly with area, but not hyperbolically.
Dgraph showing pressure decreasing inversely with area, forming a hyperbola.
✓ Correct answer
D: graph showing pressure decreasing inversely with area, forming a hyperbola.
Practise more questions on this topic
Oracle Prep sorts past-paper questions by topic, so you can drill Forces and see which topics are most likely to come up next.
Sign up free →