O-LevelPhysicsThermal Physics5054/11 · May/June 2017 · Q191 Mark
A fixed mass of gas undergoes a change of volume at constant temperature. Which diagram shows the relationship between the volume and the pressure of the gas?
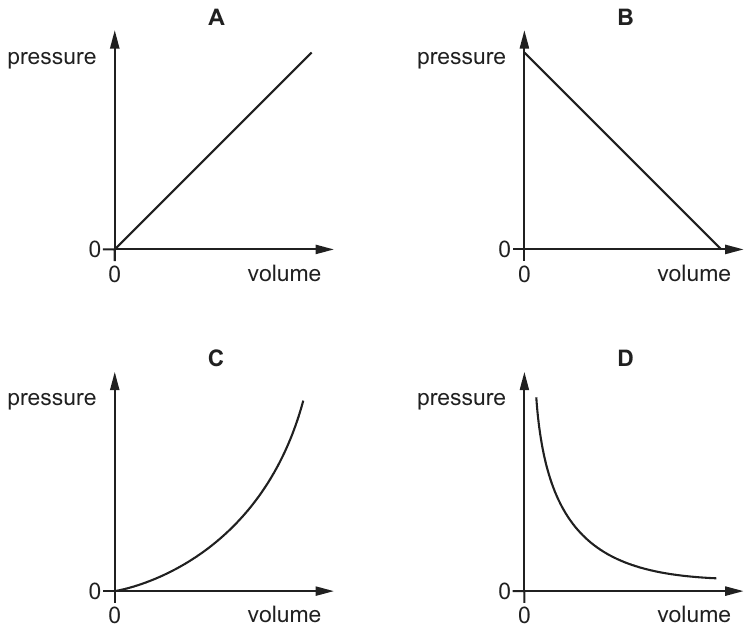
This question uses a diagram from the original paper, which isn't shown here. Open the full paper from the past papers archive to see it.
AGraph showing pressure increasing linearly with volume.
BGraph showing pressure decreasing linearly with volume.
CGraph showing pressure increasing with volume with an increasing gradient (curved).
DGraph showing pressure decreasing with volume with a decreasing gradient (curved, inverse relationship).
✓ Correct answer
D: Graph showing pressure decreasing with volume with a decreasing gradient (curved, inverse relationship).
Practise more questions on this topic
Oracle Prep sorts past-paper questions by topic, so you can drill Thermal Physics and see which topics are most likely to come up next.
Sign up free →