O-LevelPhysicsKinematics5054/11 · May/June 2010 · Q41 Mark
The speed-time graph shows the movement of a car. What does the shaded area of the graph represent?
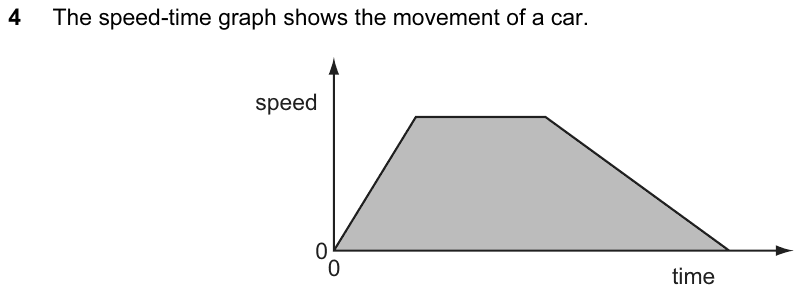
This question uses a diagram from the original paper, which isn't shown here. Open the full paper from the past papers archive to see it.
Athe average acceleration of the car
Bthe average speed of the car
Cthe total distance travelled by the car
Dthe total travelling time of the car
✓ Correct answer
C: the total distance travelled by the car
Practise more questions on this topic
Oracle Prep sorts past-paper questions by topic, so you can drill Kinematics and see which topics are most likely to come up next.
Sign up free →