O-LevelPhysicsThermal Physics5054/11 · Oct/Nov 2017 · Q131 Mark
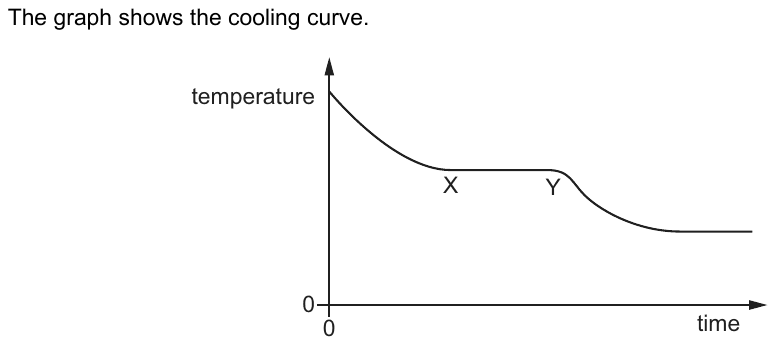
Solid wax is melted in a boiling tube and then allowed to cool. The graph shows the cooling curve. What is happening between points X and Y?
This question uses a diagram from the original paper, which isn't shown here. Open the full paper from the past papers archive to see it.
AThe liquid is at its boiling point.
BThe liquid is turning to solid.
CThe solid has reached room temperature.
DThe solid is turning to liquid.
✓ Correct answer
B: The liquid is turning to solid.
Practise more questions on this topic
Oracle Prep sorts past-paper questions by topic, so you can drill Thermal Physics and see which topics are most likely to come up next.
Sign up free →