O-LevelPhysicsMagnetism5054/11 · Oct/Nov 2014 · Q321 Mark
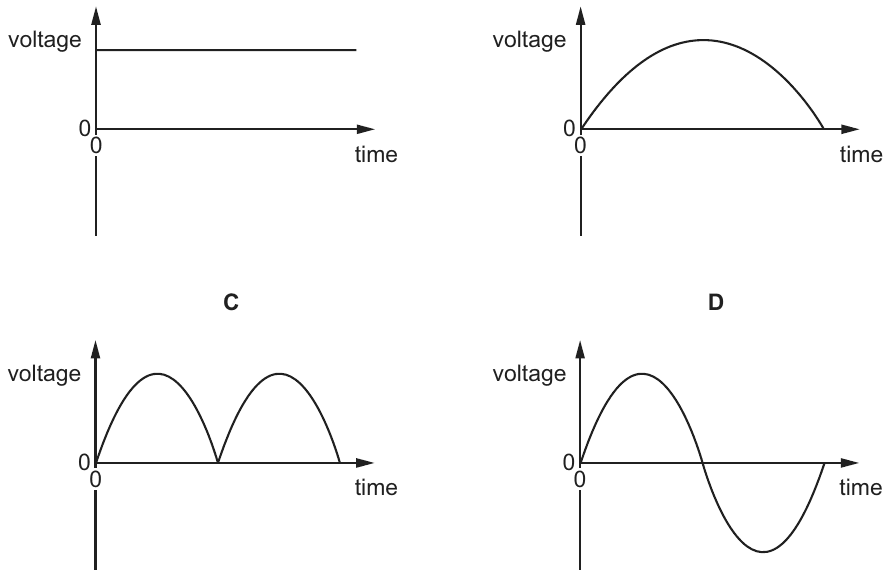
Which graph shows the voltage output of an a.c. generator when the coil makes one complete revolution?
This question uses a diagram from the original paper, which isn't shown here. Open the full paper from the past papers archive to see it.
AGraph showing constant positive voltage over time
BGraph showing voltage starting at zero, increasing to a maximum, then decreasing back to zero over time
CGraph showing voltage oscillating between a positive maximum and zero over time (rectified half-wave)
DGraph showing voltage oscillating symmetrically between positive and negative maximums over time (full sine wave)
✓ Correct answer
D: Graph showing voltage oscillating symmetrically between positive and negative maximums over time (full sine wave)
Practise more questions on this topic
Oracle Prep sorts past-paper questions by topic, so you can drill Magnetism and see which topics are most likely to come up next.
Sign up free →