O-LevelChemistryRates of Reaction5070/12 · May/June 2022 · Q211 Mark
25 cm³ of 1.0 mol/dm³ hydrochloric acid reacts with 10 g of a solid to produce a gas. The solid is in excess. The graph labelled first experiment shows the volume of gas produced over time. Graphs P and Q show the volume of gas produced under different conditions. Which changes in conditions produce graphs P and Q, if all other conditions are kept the same?
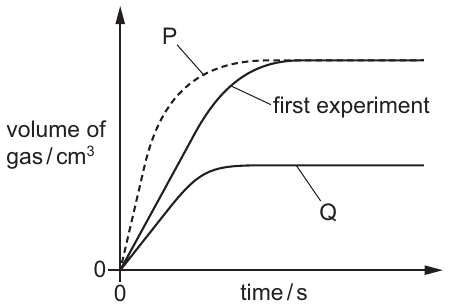
This question uses a diagram from the original paper, which isn't shown here. Open the full paper from the past papers archive to see it.
AP uses a catalyst and Q has a lower temperature.
BP uses 25 cm³ of more concentrated acid and Q uses smaller pieces of solid.
CP uses a higher temperature and Q uses 25 cm³ of more dilute acid.
DP uses smaller pieces of solid and Q uses larger pieces of solid.
✓ Correct answer
C: P uses a higher temperature and Q uses 25 cm³ of more dilute acid.
Practise more questions on this topic
Oracle Prep sorts past-paper questions by topic, so you can drill Rates of Reaction and see which topics are most likely to come up next.
Sign up free →