O-LevelChemistryChemistry of the Environment5070/12 · May/June 2016 · Q331 Mark
The diagram shows an experiment to determine the percentage of oxygen in air. Which diagram shows the correct level of water after the candle stops burning?
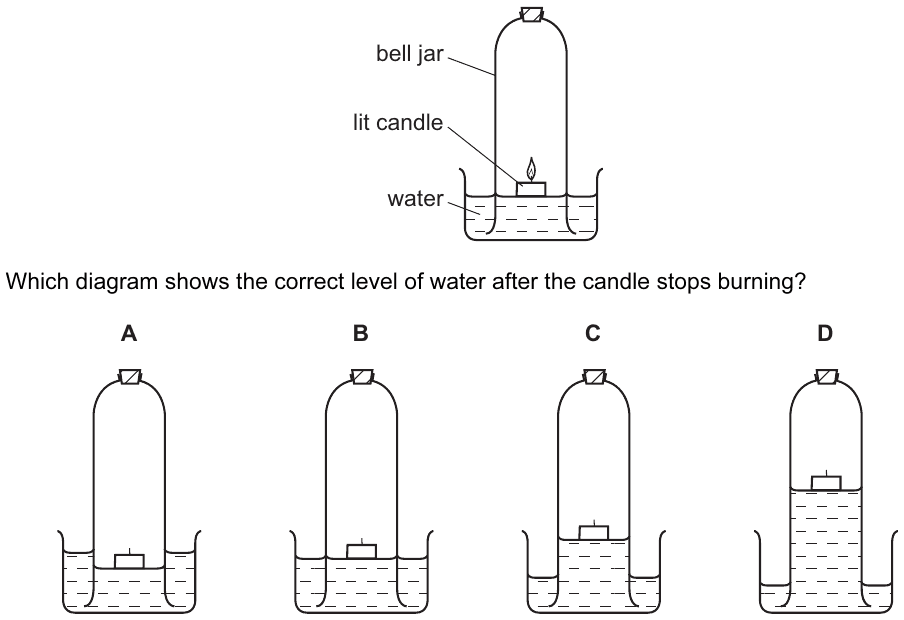
This question uses a diagram from the original paper, which isn't shown here. Open the full paper from the past papers archive to see it.
AWater level risen slightly
BWater level unchanged
CWater level risen significantly (approx 1/5 of jar)
DWater level lowered
✓ Correct answer
C: Water level risen significantly (approx 1/5 of jar)
Practise more questions on this topic
Oracle Prep sorts past-paper questions by topic, so you can drill Chemistry of the Environment and see which topics are most likely to come up next.
Sign up free →