O-LevelChemistryRates of Reaction5070/12 · May/June 2014 · Q151 Mark
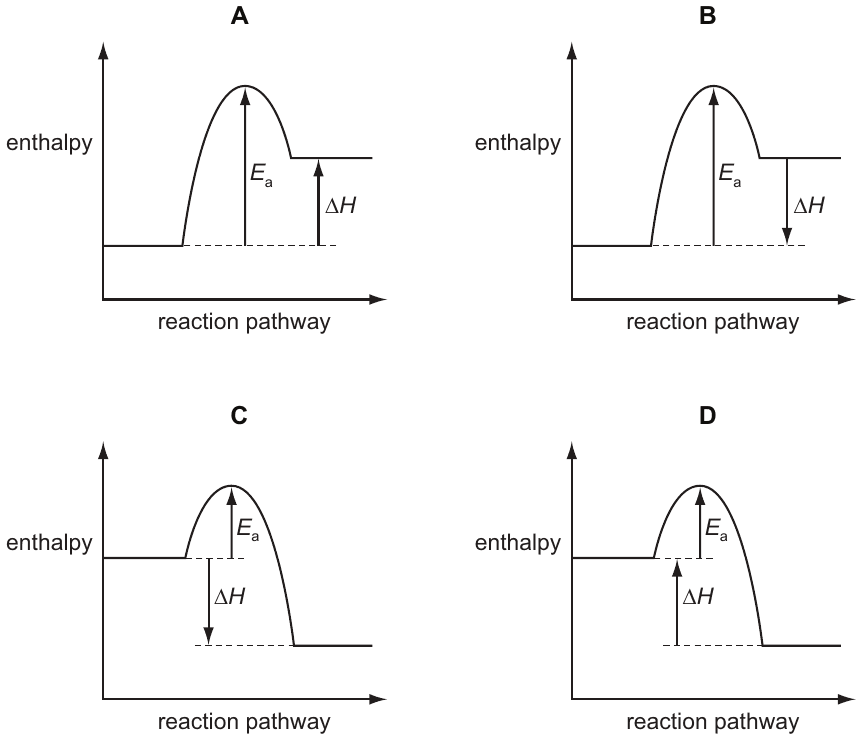
Nitrogen monoxide is an atmospheric pollutant that is formed in car engines by the reaction between nitrogen and oxygen. N₂(g) + O₂(g) → 2NO(g) ΔΗ = +66 kJ/mol Which diagram represents the energy profile for this reaction?
This question uses a diagram from the original paper, which isn't shown here. Open the full paper from the past papers archive to see it.
AEnergy profile diagram showing an endothermic reaction (products at higher enthalpy than reactants) with activation energy.
BEnergy profile diagram showing an exothermic reaction (products at lower enthalpy than reactants) with activation energy.
CEnergy profile diagram showing an exothermic reaction (products at lower enthalpy than reactants) with activation energy.
DEnergy profile diagram showing an endothermic reaction (products at higher enthalpy than reactants) with activation energy.
✓ Correct answer
A: Energy profile diagram showing an endothermic reaction (products at higher enthalpy than reactants) with activation energy.
Practise more questions on this topic
Oracle Prep sorts past-paper questions by topic, so you can drill Rates of Reaction and see which topics are most likely to come up next.
Sign up free →