O-LevelChemistryRates of Reaction5070/11 · Oct/Nov 2022 · Q221 Mark
The rate of reaction between magnesium and dilute hydrochloric acid is investigated. The equation is shown. Mg(s) + 2HCl(aq) → MgCl2(aq) + H2(g) A known mass of magnesium is added to an excess of dilute hydrochloric acid. The concentration of the hydrochloric acid and the volume of hydrogen produced is measured at regular time intervals. Which pair of graphs correctly shows the experimental results? [Figures A, B, C, D showing pairs of graphs for concentration of HCl vs time and volume of hydrogen vs time]
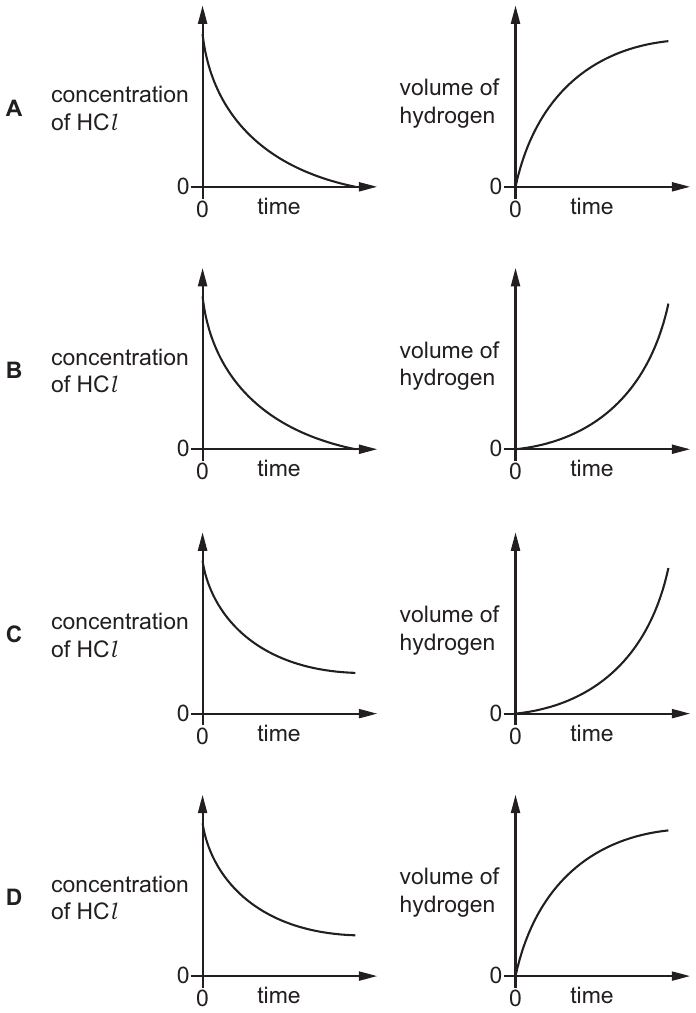
This question uses a diagram from the original paper, which isn't shown here. Open the full paper from the past papers archive to see it.
ADiagram A
BDiagram B
CDiagram C
DDiagram D
✓ Correct answer
D: Diagram D
Practise more questions on this topic
Oracle Prep sorts past-paper questions by topic, so you can drill Rates of Reaction and see which topics are most likely to come up next.
Sign up free →