O-LevelChemistryRates of Reaction5070/12 · Oct/Nov 2021 · Q251 Mark
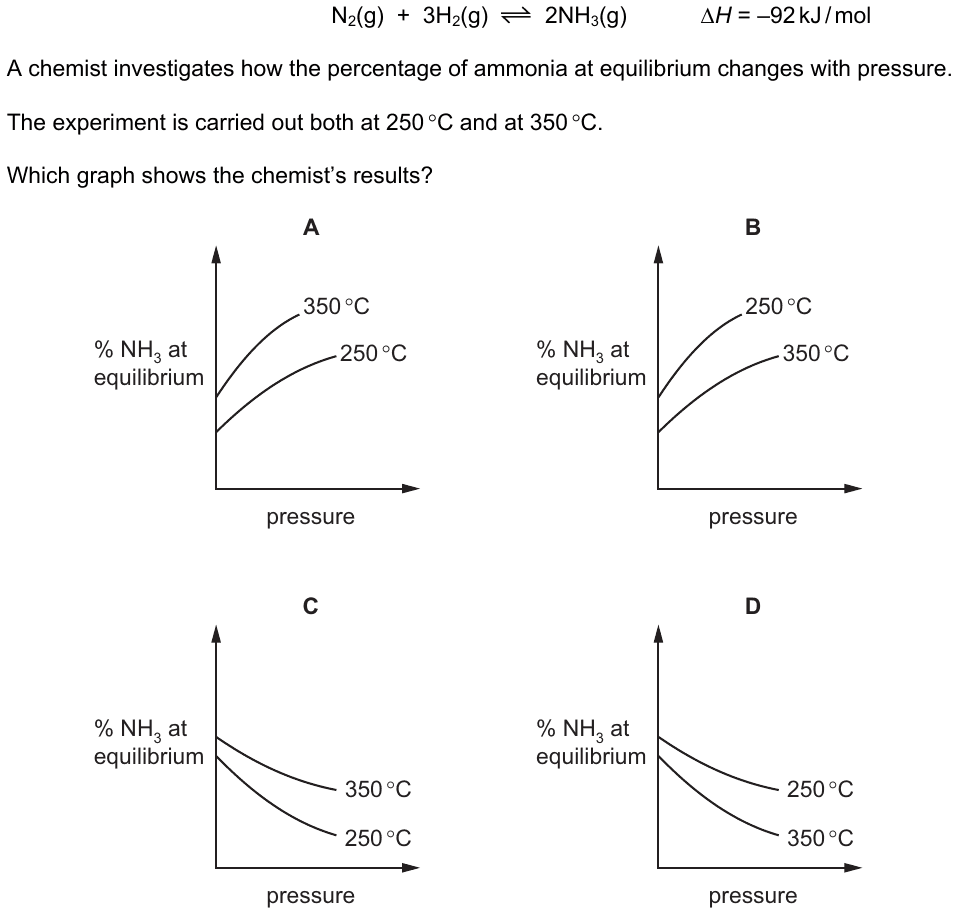
Ammonia is made by a reversible reaction. N2(g) + 3H2(g) ⇌ 2NH3(g) ΔH = −92 kJ/mol A chemist investigates how the percentage of ammonia at equilibrium changes with pressure. The experiment is carried out both at 250 °C and at 350 °C. Which graph shows the chemist's results?
This question uses a diagram from the original paper, which isn't shown here. Open the full paper from the past papers archive to see it.
AGraph showing % NH3 at equilibrium increasing with pressure, with the 250 °C curve above the 350 °C curve.
BGraph showing % NH3 at equilibrium increasing with pressure, with the 350 °C curve above the 250 °C curve.
CGraph showing % NH3 at equilibrium decreasing with pressure, with the 350 °C curve above the 250 °C curve.
DGraph showing % NH3 at equilibrium decreasing with pressure, with the 250 °C curve below the 350 °C curve.
✓ Correct answer
B: Graph showing % NH3 at equilibrium increasing with pressure, with the 350 °C curve above the 250 °C curve.
Practise more questions on this topic
Oracle Prep sorts past-paper questions by topic, so you can drill Rates of Reaction and see which topics are most likely to come up next.
Sign up free →