O-LevelChemistryRates of Reaction5070/11 · Oct/Nov 2019 · Q151 Mark
Gas P decomposes to form gas Q. xP → yQ Two experiments are carried out to investigate the rate of reaction. The conditions are the same except that two different temperatures, T₁ and T₂, are used. The results are plotted on graphs, drawn to the same scale. [Two graphs showing volume of P and Q vs time at temperatures T1 and T2] Which row is correct?
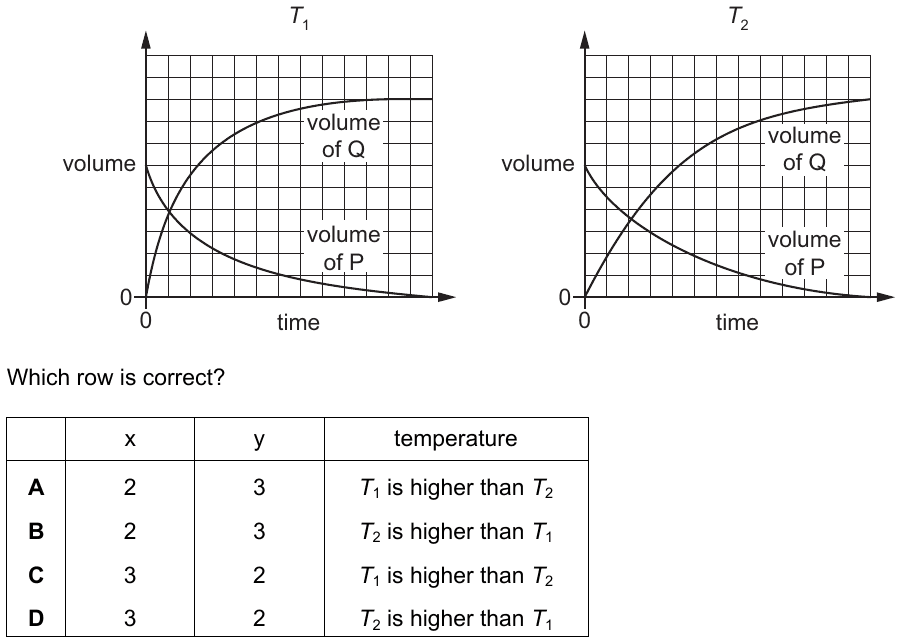
This question uses a diagram from the original paper, which isn't shown here. Open the full paper from the past papers archive to see it.
AX:2, Y:3, temperature:T₁ is higher than T₂
BX:2, Y:3, temperature:T₂ is higher than T₁
CX:3, Y:2, temperature:T₁ is higher than T₂
DX:3, Y:2, temperature:T₂ is higher than T₁
✓ Correct answer
A: X:2, Y:3, temperature:T₁ is higher than T₂
Practise more questions on this topic
Oracle Prep sorts past-paper questions by topic, so you can drill Rates of Reaction and see which topics are most likely to come up next.
Sign up free →