O-LevelChemistryRates of Reaction5070/12 · Oct/Nov 2016 · Q171 Mark
In two experiments, 1 and 2, an excess of powdered calcium carbonate was reacted in a flask with dilute hydrochloric acid. In experiment 1, the carbon dioxide evolved was collected and the volume of gas measured at regular intervals. In experiment 2, the mass of the flask and its contents was measured at regular intervals. The results of both experiments were plotted on graphs. [Graphs W, X, Y, Z] Which graphs correctly show the results of these two experiments?
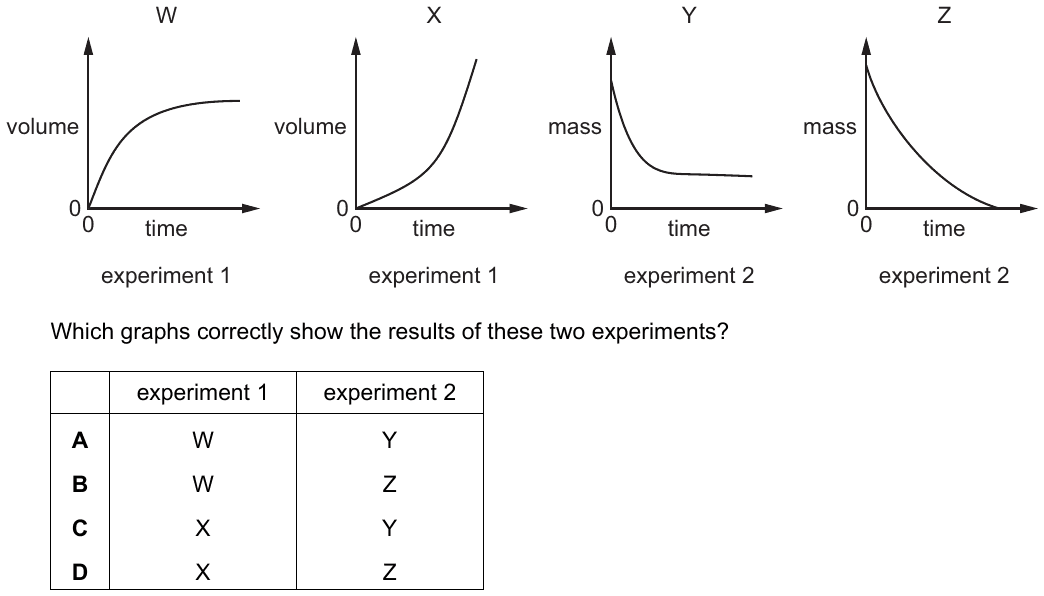
This question uses a diagram from the original paper, which isn't shown here. Open the full paper from the past papers archive to see it.
AW, Y
BW, Z
CX, Y
DX, Z
✓ Correct answer
A: W, Y
Practise more questions on this topic
Oracle Prep sorts past-paper questions by topic, so you can drill Rates of Reaction and see which topics are most likely to come up next.
Sign up free →