O-LevelChemistryMetals & Reactivity5070/12 · Oct/Nov 2016 · Q51 Mark
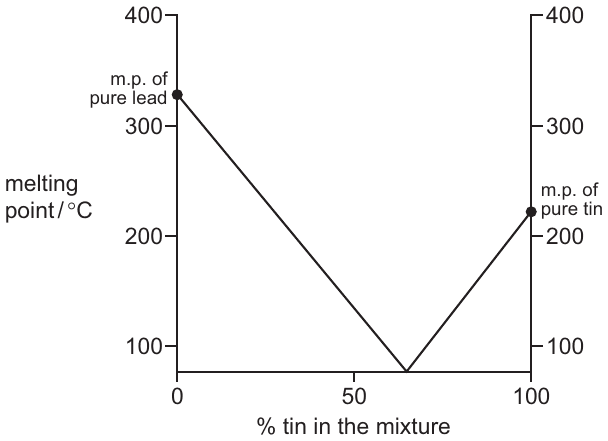
The graph gives the melting points (m.p.) of mixtures of lead and tin. The graph shows that any mixture of lead and tin must have a melting point that is
This question uses a diagram from the original paper, which isn't shown here. Open the full paper from the past papers archive to see it.
Aabove that of tin.
Bbelow that of lead.
Cbelow that of both tin and lead.
Dbetween that of tin and lead.
✓ Correct answer
B: below that of lead.
Practise more questions on this topic
Oracle Prep sorts past-paper questions by topic, so you can drill Metals & Reactivity and see which topics are most likely to come up next.
Sign up free →