O-LevelChemistryRates of Reaction5070/11 · May/June 2010 · Q131 Mark
A student performs two reactions. reaction 1 10 g of magnesium ribbon with excess 2.0mol/dm³ dilute hydrochloric acid reaction 2 5g of magnesium powder with excess 2.0mol/dm³ dilute hydrochloric acid In both experiments, the volume of hydrogen produced, V, is measured against time, t, and the results plotted graphically. Which set of graphs is correct?
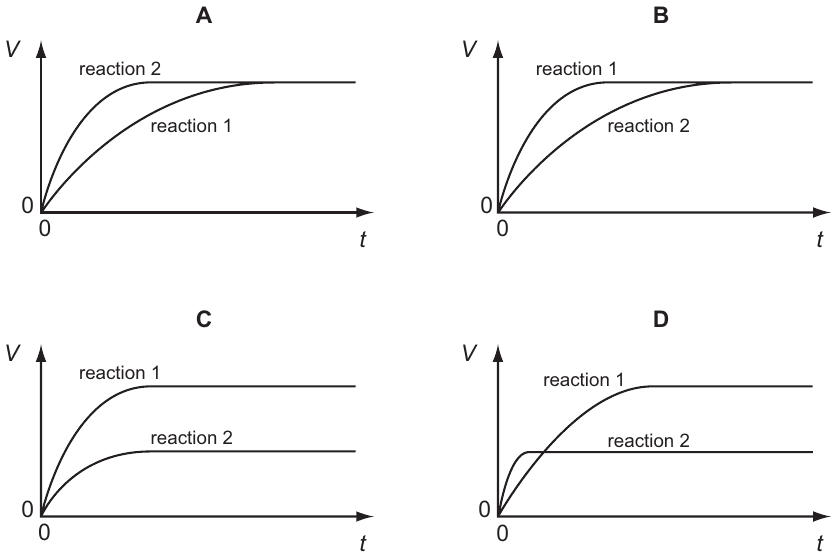
This question uses a diagram from the original paper, which isn't shown here. Open the full paper from the past papers archive to see it.
AA
BB
CC
DD
✓ Correct answer
D: D
Practise more questions on this topic
Oracle Prep sorts past-paper questions by topic, so you can drill Rates of Reaction and see which topics are most likely to come up next.
Sign up free →