O-LevelChemistryAtomic Structure5070/11 · Oct/Nov 2013 · Q41 Mark
The apparatus shown is used to distil a dilute solution of ethanol in water. [B.P.: ethanol, 78°C; water 100°C] Which graph shows the change in concentration of the ethanol in the boiling flask as the distillation proceeds?
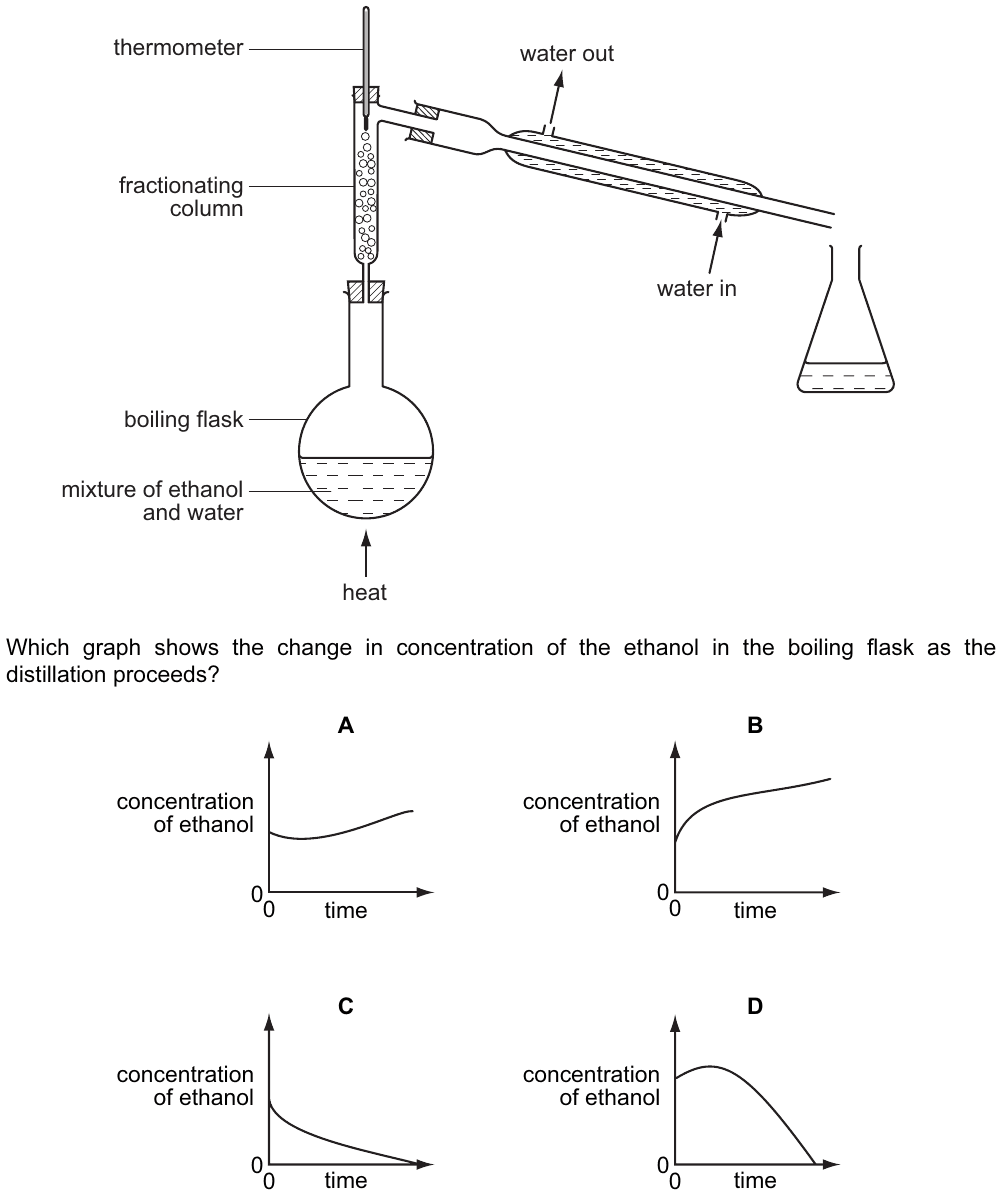
This question uses a diagram from the original paper, which isn't shown here. Open the full paper from the past papers archive to see it.
Agraph with concentration of ethanol on the y-axis and time on the x-axis, showing a curve that starts high, dips, then rises slightly above the starting point and flattens.
Bgraph with concentration of ethanol on the y-axis and time on the x-axis, showing a curve that starts at zero and steadily increases to a plateau.
Cgraph with concentration of ethanol on the y-axis and time on the x-axis, showing a curve that starts high and steadily decreases to a plateau.
Dgraph with concentration of ethanol on the y-axis and time on the x-axis, showing a curve that starts high, dips, then rises again.
✓ Correct answer
C: graph with concentration of ethanol on the y-axis and time on the x-axis, showing a curve that starts high and steadily decreases to a plateau.
Practise more questions on this topic
Oracle Prep sorts past-paper questions by topic, so you can drill Atomic Structure and see which topics are most likely to come up next.
Sign up free →